chipotle
in Study on datavisualization
import pandas as pd
read_csv 함수로 데이터를 Dataframe 형태로 불러옵니다.
file_path = ‘data/chipotle.tsv’ chipo = pd.read_csv(file_path, sep = ‘\t’)
```python
print(chipo.shape)
print("------------------------------------")
print(chipo.info())
(4622, 5)
------------------------------------
<class 'pandas.core.frame.DataFrame'>
RangeIndex: 4622 entries, 0 to 4621
Data columns (total 5 columns):
 #   Column              Non-Null Count  Dtype
---  ------              --------------  -----
 0   order_id            4622 non-null   int64
 1   quantity            4622 non-null   int64
 2   item_name           4622 non-null   object
 3   choice_description  3376 non-null   object
 4   item_price          4622 non-null   object
dtypes: int64(2), object(3)
memory usage: 180.7+ KB
None
chipo.head(20)
| order_id | quantity | item_name | choice_description | item_price | |
|---|---|---|---|---|---|
| 0 | 1 | 1 | Chips and Fresh Tomato Salsa | NaN | $2.39 |
| 1 | 1 | 1 | Izze | [Clementine] | $3.39 |
| 2 | 1 | 1 | Nantucket Nectar | [Apple] | $3.39 |
| 3 | 1 | 1 | Chips and Tomatillo-Green Chili Salsa | NaN | $2.39 |
| 4 | 2 | 2 | Chicken Bowl | [Tomatillo-Red Chili Salsa (Hot), [Black Beans... | $16.98 |
| 5 | 3 | 1 | Chicken Bowl | [Fresh Tomato Salsa (Mild), [Rice, Cheese, Sou... | $10.98 |
| 6 | 3 | 1 | Side of Chips | NaN | $1.69 |
| 7 | 4 | 1 | Steak Burrito | [Tomatillo Red Chili Salsa, [Fajita Vegetables... | $11.75 |
| 8 | 4 | 1 | Steak Soft Tacos | [Tomatillo Green Chili Salsa, [Pinto Beans, Ch... | $9.25 |
| 9 | 5 | 1 | Steak Burrito | [Fresh Tomato Salsa, [Rice, Black Beans, Pinto... | $9.25 |
| 10 | 5 | 1 | Chips and Guacamole | NaN | $4.45 |
| 11 | 6 | 1 | Chicken Crispy Tacos | [Roasted Chili Corn Salsa, [Fajita Vegetables,... | $8.75 |
| 12 | 6 | 1 | Chicken Soft Tacos | [Roasted Chili Corn Salsa, [Rice, Black Beans,... | $8.75 |
| 13 | 7 | 1 | Chicken Bowl | [Fresh Tomato Salsa, [Fajita Vegetables, Rice,... | $11.25 |
| 14 | 7 | 1 | Chips and Guacamole | NaN | $4.45 |
| 15 | 8 | 1 | Chips and Tomatillo-Green Chili Salsa | NaN | $2.39 |
| 16 | 8 | 1 | Chicken Burrito | [Tomatillo-Green Chili Salsa (Medium), [Pinto ... | $8.49 |
| 17 | 9 | 1 | Chicken Burrito | [Fresh Tomato Salsa (Mild), [Black Beans, Rice... | $8.49 |
| 18 | 9 | 2 | Canned Soda | [Sprite] | $2.18 |
| 19 | 10 | 1 | Chicken Bowl | [Tomatillo Red Chili Salsa, [Fajita Vegetables... | $8.75 |
print(chipo.columns)
print("------------------------------------")
print(chipo.index)
Index(['order_id', 'quantity', 'item_name', 'choice_description',
       'item_price'],
      dtype='object')
------------------------------------
RangeIndex(start=0, stop=4622, step=1)
chipo['order_id'] = chipo['order_id'].astype(str) # order_id는 숫자의 의미를 가지지 않기 때문에 str으로 변환합니다.
print(chipo.describe()) # chipo dataframe에서 수치형 피처들의 요약 통계량을 확인합니다.
          quantity
count  4622.000000
mean      1.075725
std       0.410186
min       1.000000
25%       1.000000
50%       1.000000
75%       1.000000
max      15.000000
print(len(chipo['order_id'].unique())) # order_id의 개수를 출력합니다.
print(len(chipo['item_name'].unique())) # item_name의 개수를 출력합니다.
1834
50
# 가장 많이 주문한 item : top 10을 출력합니다.
item_count = chipo['item_name'].value_counts()[:10]
for idx, (val, cnt) in enumerate(item_count.iteritems(), 1):
    print("Top", idx, ":", val, cnt)
Top 1 : Chicken Bowl 726
Top 2 : Chicken Burrito 553
Top 3 : Chips and Guacamole 479
Top 4 : Steak Burrito 368
Top 5 : Canned Soft Drink 301
Top 6 : Chips 211
Top 7 : Steak Bowl 211
Top 8 : Bottled Water 162
Top 9 : Chicken Soft Tacos 115
Top 10 : Chicken Salad Bowl 110
chipo['item_name'].value_counts().index.tolist()[0]
#가장 많이 주문한 아이템
'Chicken Bowl'
# item당 주문 개수를 출력합니다.
order_count = chipo.groupby('item_name')['order_id'].count()
order_count[:10] # item당 주문 개수를 출력합니다.
item_name
6 Pack Soft Drink         54
Barbacoa Bowl             66
Barbacoa Burrito          91
Barbacoa Crispy Tacos     11
Barbacoa Salad Bowl       10
Barbacoa Soft Tacos       25
Bottled Water            162
Bowl                       2
Burrito                    6
Canned Soda              104
Name: order_id, dtype: int64
# item당 주문 총량을 출력합니다.
item_quantity = chipo.groupby('item_name')['quantity'].sum()
item_quantity[:10] # item당 주문 총량을 출력합니다.
item_name
6 Pack Soft Drink         55
Barbacoa Bowl             66
Barbacoa Burrito          91
Barbacoa Crispy Tacos     12
Barbacoa Salad Bowl       10
Barbacoa Soft Tacos       25
Bottled Water            211
Bowl                       4
Burrito                    6
Canned Soda              126
Name: quantity, dtype: int64
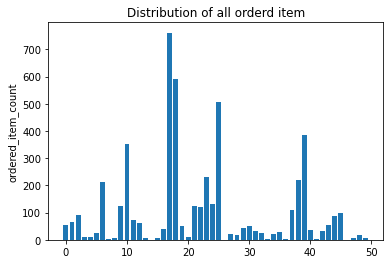
[시각화로 분석 결과 살펴보기]
- 지금까지의 분석 결과를 간단한 시각화로 표현
%matplotlib inline
import numpy as np
import matplotlib.pyplot as plt

item_name_list = item_quantity.index.tolist()
x_pos = np.arange(len(item_name_list))
order_cnt = item_quantity.values.tolist()

plt.bar(x_pos, order_cnt, align='center')
plt.ylabel('ordered_item_count')
plt.title('Distribution of all orderd item')

plt.show()
[apply와 lambda 함수를 이용한 데이터 전처리]
print(chipo.info())
print('-------------')
chipo['item_price'].head()
<class 'pandas.core.frame.DataFrame'>
RangeIndex: 4622 entries, 0 to 4621
Data columns (total 5 columns):
 #   Column              Non-Null Count  Dtype
---  ------              --------------  -----
 0   order_id            4622 non-null   object
 1   quantity            4622 non-null   int64
 2   item_name           4622 non-null   object
 3   choice_description  3376 non-null   object
 4   item_price          4622 non-null   float64
dtypes: float64(1), int64(1), object(3)
memory usage: 180.7+ KB
None
-------------


0     2.39
1     3.39
2     3.39
3     2.39
4    16.98
Name: item_price, dtype: float64
# column 단위 데이터에 apply 함수로 전처리를 적용합니다.
#chipo['item_price'] = chipo['item_price'].apply(lambda x: float(x[1:]))
chipo.describe()
| quantity | item_price | |
|---|---|---|
| count | 4622.000000 | 4622.000000 |
| mean | 1.075725 | 7.464336 |
| std | 0.410186 | 4.245557 |
| min | 1.000000 | 1.090000 |
| 25% | 1.000000 | 3.390000 |
| 50% | 1.000000 | 8.750000 |
| 75% | 1.000000 | 9.250000 |
| max | 15.000000 | 44.250000 |
chipo['item_price'].head()
0     2.39
1     3.39
2     3.39
3     2.39
4    16.98
Name: item_price, dtype: float64
<탐색적 분석=""> : 스무고개로 분석하는 개념적 탐색
# 주문당 평균 계산금액을 출력합니다.
chipo.groupby('order_id')['item_price'].sum().mean()
18.811428571428717
# 주문당 계산금액이 가장 높은 10개
chipo.groupby('order_id')['item_price'].sum().describe()[:10]
count    1834.000000
mean       18.811429
std        11.652512
min        10.080000
25%        12.572500
50%        16.200000
75%        21.960000
max       205.250000
Name: item_price, dtype: float64
# 한 주문에 10달러 이상 사용한 id를 출력합니다.
chipo_orderid_group = chipo.groupby('order_id').sum()
results = chipo_orderid_group[chipo_orderid_group.item_price >= 10]

print(results[:10])
print(results.index.values)
          quantity  item_price
order_id
1                4       11.56
10               2       13.20
100              2       10.08
1000             2       20.50
1001             2       10.08
1002             2       10.68
1003             2       13.00
1004             2       21.96
1005             3       12.15
1006             8       71.40
['1' '10' '100' ... '997' '998' '999']
# 각 아이템의 가격을 계산합니다.
chipo_one_item = chipo[chipo.quantity == 1]
price_per_item = chipo_one_item.groupby('item_name').min()
price_per_item.sort_values(by = "item_price", ascending = False)[:10]
#sort_values 특정한 기준으로 정렬해서 보여줌 내림차순으로 상위 10개
| order_id | quantity | choice_description | item_price | |
|---|---|---|---|---|
| item_name | ||||
| Steak Salad Bowl | 1032 | 1 | [Fresh Tomato Salsa, Lettuce] | 9.39 |
| Barbacoa Salad Bowl | 1283 | 1 | [Fresh Tomato Salsa, Guacamole] | 9.39 |
| Carnitas Salad Bowl | 1035 | 1 | [Fresh Tomato Salsa, [Rice, Black Beans, Chees... | 9.39 |
| Carnitas Soft Tacos | 1011 | 1 | [Fresh Tomato Salsa (Mild), [Black Beans, Rice... | 8.99 |
| Carnitas Crispy Tacos | 1774 | 1 | [Fresh Tomato Salsa, [Fajita Vegetables, Rice,... | 8.99 |
| Steak Soft Tacos | 1054 | 1 | [Fresh Tomato Salsa (Mild), [Cheese, Sour Cream]] | 8.99 |
| Carnitas Salad | 1500 | 1 | [[Fresh Tomato Salsa (Mild), Roasted Chili Cor... | 8.99 |
| Carnitas Bowl | 1007 | 1 | [Fresh Tomato (Mild), [Guacamole, Lettuce, Ric... | 8.99 |
| Barbacoa Soft Tacos | 1103 | 1 | [Fresh Tomato Salsa, [Black Beans, Cheese, Let... | 8.99 |
| Barbacoa Crispy Tacos | 110 | 1 | [Fresh Tomato Salsa, Guacamole] | 8.99 |
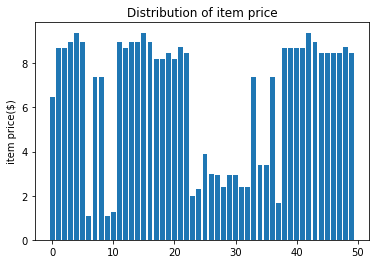
# 아이템 가격 분포 그래프를 출력합니다.
item_name_list = price_per_item.index.tolist()
x_pos = np.arange(len(item_name_list))
item_price = price_per_item['item_price'].tolist()

plt.bar(x_pos, item_price, align='center')
plt.ylabel('item price($)')
plt.title('Distribution of item price')

plt.show()
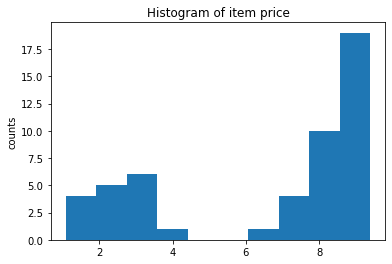
# 아이템 가격 히스토그램을 출력합니다.
plt.hist(item_price)
plt.ylabel('counts')
plt.title('Histogram of item price')

plt.show()
# 가장 비싼 주문에서 item이 총 몇개 팔렸는지를 계산합니다.
chipo.groupby('order_id').sum().sort_values(by='item_price', ascending=False)[:5]
| quantity | item_price | |
|---|---|---|
| order_id | ||
| 926 | 23 | 205.25 |
| 1443 | 35 | 160.74 |
| 1483 | 14 | 139.00 |
| 691 | 11 | 118.25 |
| 1786 | 20 | 114.30 |
# “Veggie Salad Bowl”이 몇 번 주문되었는지를 계산합니다.
chipo_salad = chipo[chipo['item_name'] == "Veggie Salad Bowl"]
chipo_salad = chipo_salad.drop_duplicates(['item_name', 'order_id']) # 한 주문 내에서 중복 집계된 item_name을 제거합니다.
# drop_duplicates는 중복이 제거된다.

print(len(chipo_salad))
chipo_salad.head(5)
18
| order_id | quantity | item_name | choice_description | item_price | |
|---|---|---|---|---|---|
| 186 | 83 | 1 | Veggie Salad Bowl | [Fresh Tomato Salsa, [Fajita Vegetables, Rice,... | 11.25 |
| 295 | 128 | 1 | Veggie Salad Bowl | [Fresh Tomato Salsa, [Fajita Vegetables, Lettu... | 11.25 |
| 455 | 195 | 1 | Veggie Salad Bowl | [Fresh Tomato Salsa, [Fajita Vegetables, Rice,... | 11.25 |
| 496 | 207 | 1 | Veggie Salad Bowl | [Fresh Tomato Salsa, [Rice, Lettuce, Guacamole... | 11.25 |
| 960 | 394 | 1 | Veggie Salad Bowl | [Fresh Tomato Salsa, [Fajita Vegetables, Lettu... | 8.75 |